# Load pre-computed data from CSVs
load_season_data <- function(szn) {
  shooting <- read.csv(paste0("https://raw.githubusercontent.com/jsettimi/joseph-settimi-site/main/scripts/data/shooting_", szn, ".csv"))
  teams <- read.csv(paste0("https://raw.githubusercontent.com/jsettimi/joseph-settimi-site/main/scripts/data/teams_", szn, ".csv"))
  list(shooting = shooting, teams = teams)
}

# Load default season
data_2025 <- load_season_data("2025-26")
players <- data_2025$shooting
teams_df <- data_2025$teams

ui <- fluidPage(
  tags$head(
    tags$style(HTML("
      body {
        font-family: -apple-system, BlinkMacSystemFont, 'Segoe UI', sans-serif;
        background-color: #f9fafb;
      }
      .shiny-input-container {
        margin-bottom: 1.5rem;
      }
      .shiny-input-container label {
        font-weight: 600;
        color: #1f2937;
        margin-bottom: 0.5rem;
        font-size: 0.95rem;
      }
      select, input {
        border-radius: 6px;
        border: 1px solid #d1d5db;
        padding: 0.5rem 0.75rem;
        font-size: 0.95rem;
      }
      select:focus, input:focus {
        outline: none;
        border-color: #0ea5e9;
        box-shadow: 0 0 0 3px rgba(14, 165, 233, 0.1);
      }
      h1 {
        color: #000;
        font-weight: 800;
        margin: 0 0 0.5rem 0;
        font-size: 2rem;
      }
      .section-desc {
        color: #666;
        margin-bottom: 2rem;
        font-size: 1rem;
      }
      #stat_label, #offense_label, #defense_label {
        display: block;
        font-weight: 600;
        margin-bottom: 0.5rem;
      }
    "))
  ),

  div(
    style = "padding: 2rem; max-width: 1200px; margin: 0 auto;",

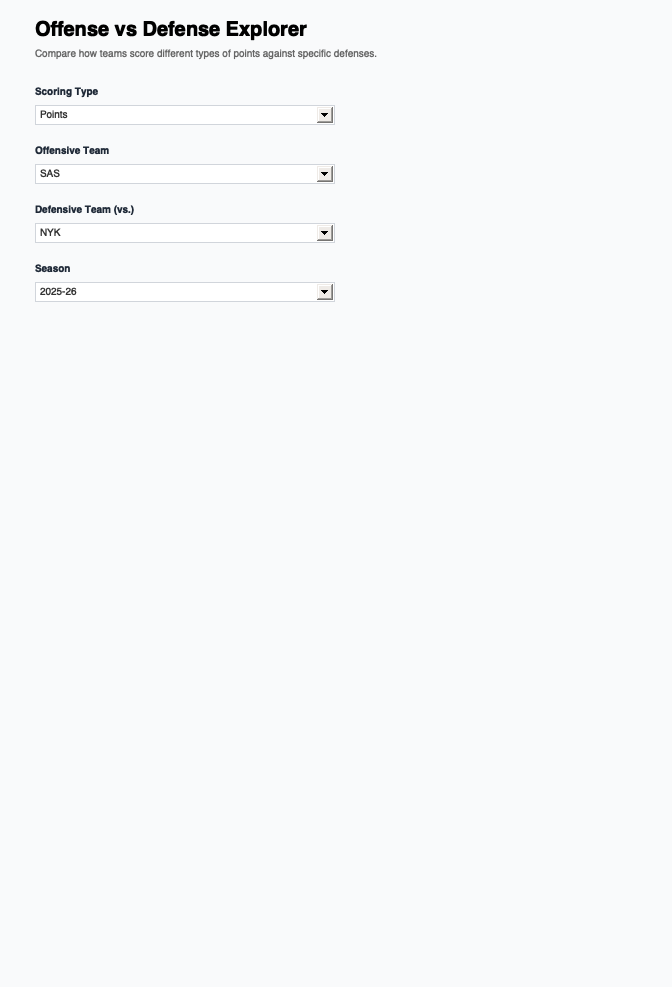
    h1("Offense vs Defense Explorer"),
    p("Compare how teams score different types of points against specific defenses.",
      class = "section-desc"),

    fluidRow(
      column(3,
        selectInput("stat", "Scoring Type",
          choices = c("Points" = "POINTS", "Drives" = "DRIVE",
                      "Catch & Shoot" = "CATCH_SHOOT", "Pull Ups" = "PULL_UP",
                      "Paint" = "PAINT", "Post" = "POST", "Elbow" = "ELBOW"),
          selected = "POINTS")
      ),
      column(3,
        selectInput("offense", "Offensive Team",
          choices = sort(unique(teams_df$TEAM_ABBREVIATION)),
          selected = "SAS")
      ),
      column(3,
        selectInput("defense", "Defensive Team (vs.)",
          choices = sort(unique(teams_df$TEAM_ABBREVIATION)),
          selected = "NYK")
      ),
      column(3,
        selectInput("season", "Season",
          choices = c("2025-26", "2024-25", "2023-24", "2022-23", "2021-22"),
          selected = "2025-26")
      )
    ),

    plotlyOutput("ovd_plot", height = "650px")
  )
)

server <- function(input, output, session) {

  # Reactive data loader
  season_data <- reactive({
    tryCatch({
      load_season_data(input$season)
    }, error = function(e) {
      list(shooting = players, teams = teams_df)
    })
  })

  output$ovd_plot <- renderPlotly({
    data <- season_data()
    players_szn <- data$shooting

    col_map <- c(
      POINTS = "POINTS",
      DRIVE = "DRIVE_PTS",
      CATCH_SHOOT = "CATCH_SHOOT_PTS",
      PULL_UP = "PULL_UP_PTS",
      PAINT = "PAINT_TOUCH_PTS",
      POST = "POST_TOUCH_PTS",
      ELBOW = "ELBOW_TOUCH_PTS"
    )

    stat_col <- col_map[input$stat]

    # Filter for offensive team
    off_players <- players_szn %>%
      filter(TEAM_ABBREVIATION == input$offense) %>%
      arrange(desc(!!sym(stat_col))) %>%
      slice(1:10)

    if (nrow(off_players) == 0) {
      return(plotly_empty(type = "scatter", mode = "markers") %>%
        layout(title = "No data available"))
    }

    stat_label <- gsub("_", " ", input$stat)

    p <- off_players %>%
      ggplot(aes(x = reorder(PLAYER_NAME, !!sym(stat_col)), y = !!sym(stat_col),
                 fill = !!sym(stat_col))) +
      geom_col(alpha = 0.8, color = "#e5e7eb", linewidth = 0.5) +
      scale_fill_gradient(low = "#e0f2fe", high = "#0ea5e9", guide = "none") +
      coord_flip() +
      theme_minimal() +
      labs(
        title = paste0(input$offense, " vs ", input$defense, " — Top 10 in ", stat_label),
        subtitle = paste0("Season: ", input$season),
        x = "",
        y = paste0(stat_label, " PPG")
      ) +
      theme(
        plot.title = element_text(size = 16, face = "bold", color = "#000"),
        plot.subtitle = element_text(size = 12, color = "#666", margin = margin(b = 10)),
        axis.text.x = element_text(size = 11),
        axis.text.y = element_text(size = 11, face = "bold"),
        axis.title.x = element_text(size = 11, face = "bold"),
        panel.grid.major.x = element_line(color = "#f3f4f6", linewidth = 0.3),
        panel.grid.minor = element_blank()
      )

    ggplotly(p, tooltip = c("x", "y")) %>%
      layout(margin = list(l = 150, b = 50, t = 80, r = 20),
             hovermode = "y unified",
             font = list(family = "-apple-system, BlinkMacSystemFont, 'Segoe UI', sans-serif"))
  })
}

shinyApp(ui, server)